Stretch 1.0 - Tensile Tester
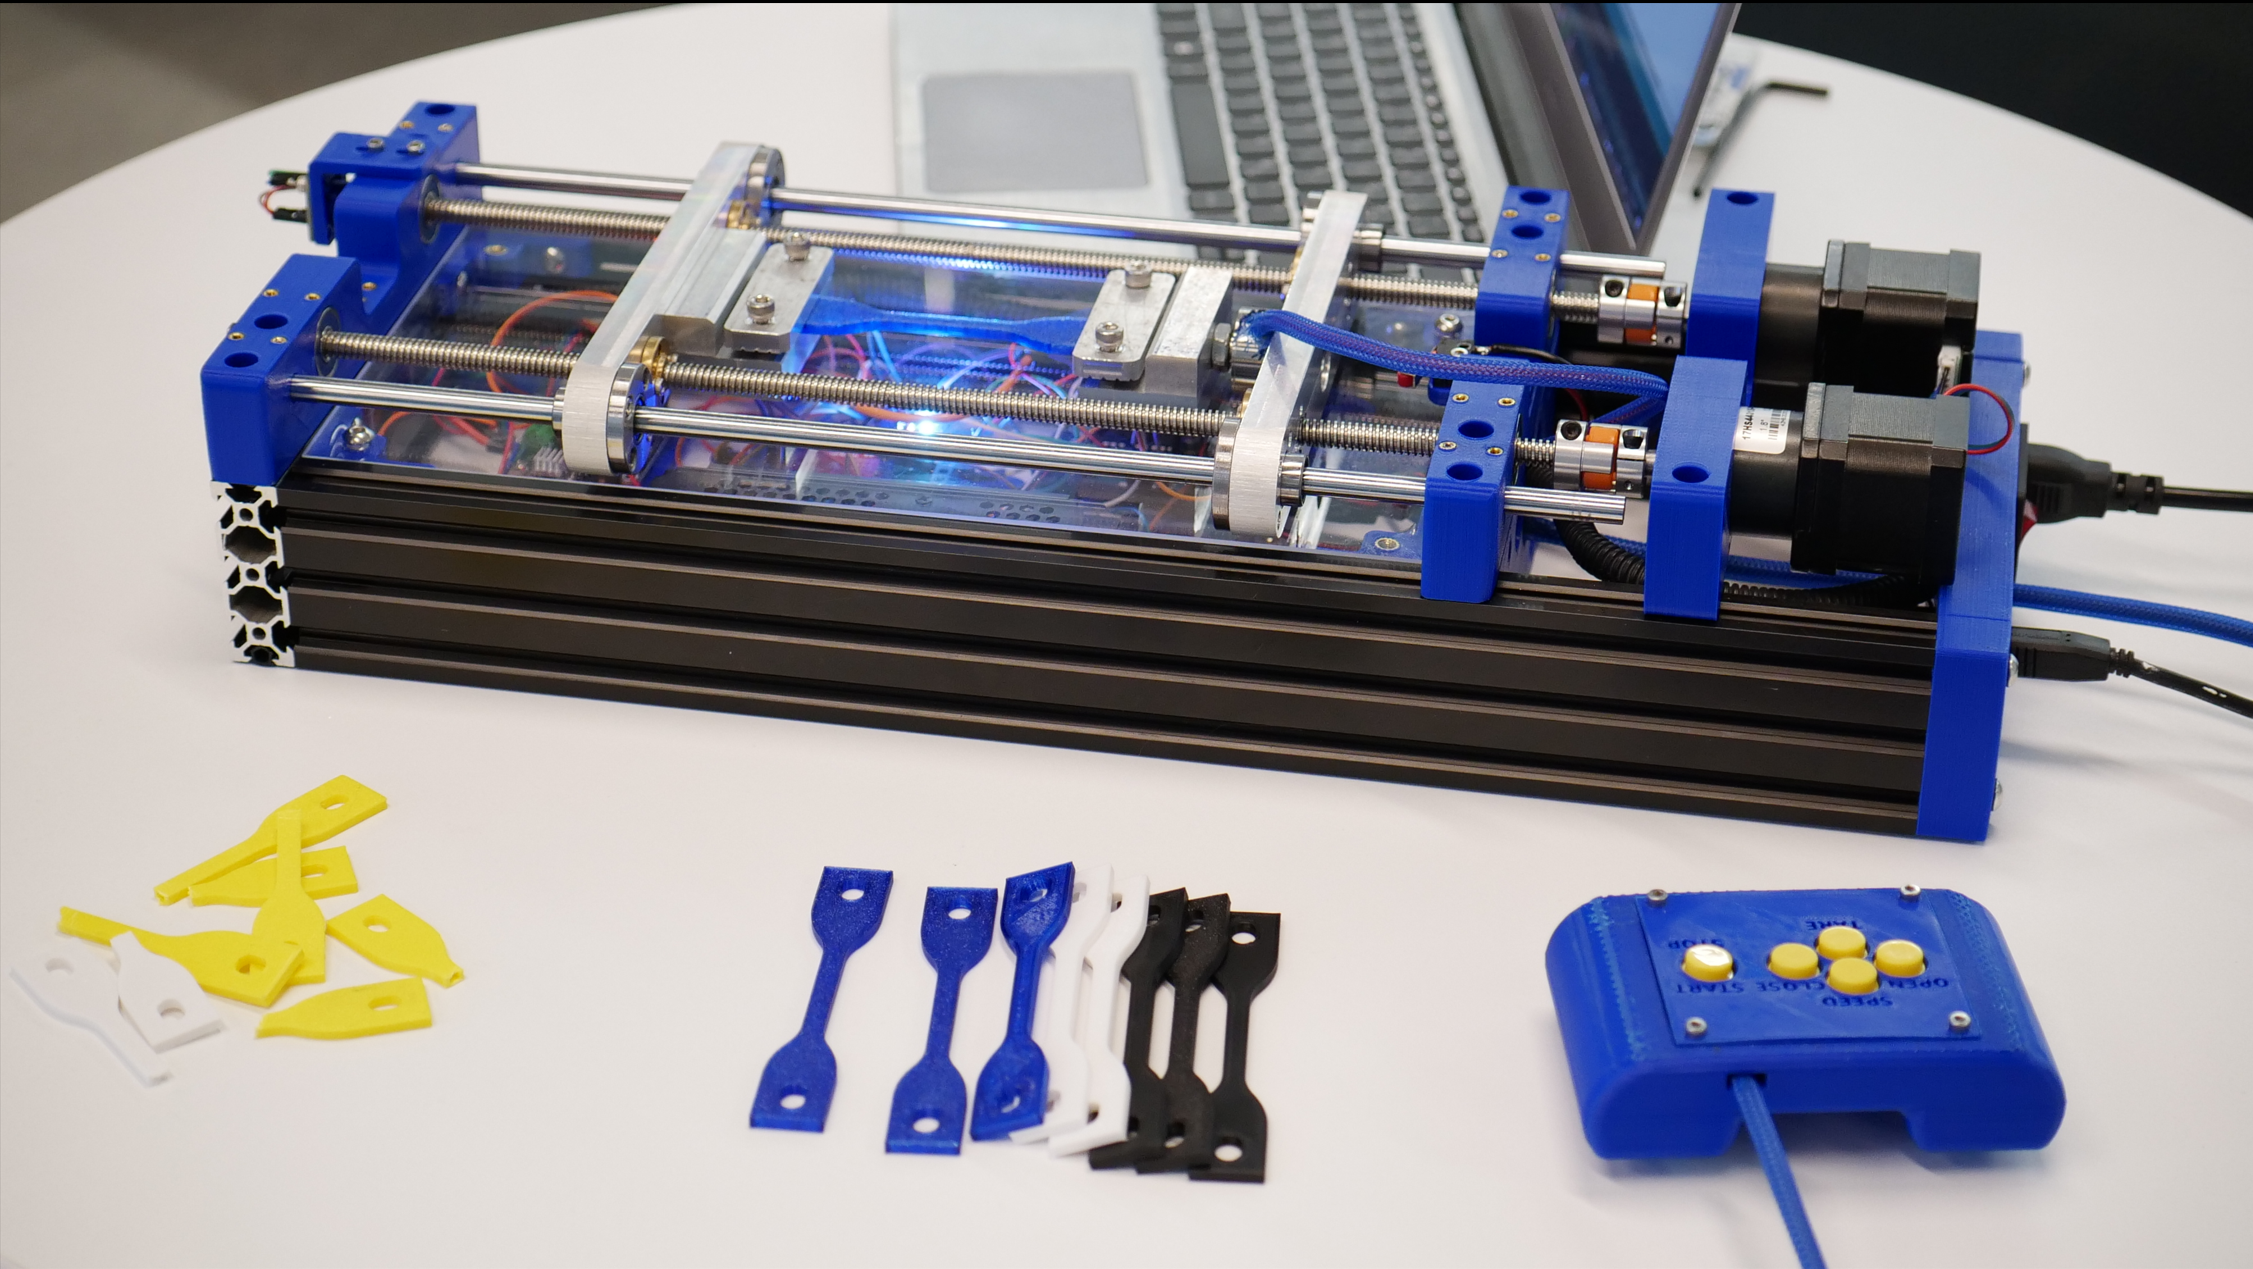
Stretch 1.0 a low-cost, accessible, desktop tensile tester for low-strength materials [< 3kN]. Developed as a final year Capstone project with fellow Mechanical Engineering Student Cole Elford.
Awards
- McMaster Capstone Expo 2023
- Winner: Best Use of Mechanical Design
- Co-Winner: Best Overall Project
- Canadian Society for Mechanical Engineers
- National Design Contest Winner: Commercial Readiness
Introduction
As I was working on the 3000W EBike project I was having trouble determining the best properties for the rear 3D printed pulley. FEA analysis and engineering design calculations analysis requires numerous mechanical properties such as Poisson’s ratio, UTS, Young’s modulus, and yield stress. None of these properties are available for 3D Printed materials due to anisotropic properties and the various print parameters all affecting these mechanical properties.
Historically, engineers and scientists have used Tensile test machines with the most popular manufacturer being ‘Instron’ to determine the mechanical properties of the materials they use. In the low force range [1kN - 25kN] typical machines cost in the range of $8,700 - $166,000 1. This project aims to solve the problem of no low-cost and accessible tensile test machines for professionals, educators, and hobbyists to determine the mechanical properties of their materials.
By lowering the barriers to entry (cost) of this type of product we can create new markets for individuals who can use these material science insights to improve their designs.
Build
This is a WIP project with plans to commercialize or make it open source. Feel free to reach out to me on LinkedIn if you have questions!
Operation
Check out this awesome video we made to showcase the product!
Software Output
The Python stress/strain graphs from Stretch 1.0 are shown below. The inputs are a batch of .csv files of different samples after which the software overlays the plots, automatically determines the key mechanical properties, and displays average test results as a dashed black line and below the curve. Many polymers don’t exhibit hookean behavior rendering the linear region less valuable but our software automatic elastic region determination is useful for other materials. Additionally, the yield point is typically so close to the UTS point that they are generally assumed to be synonymous in many plastics.
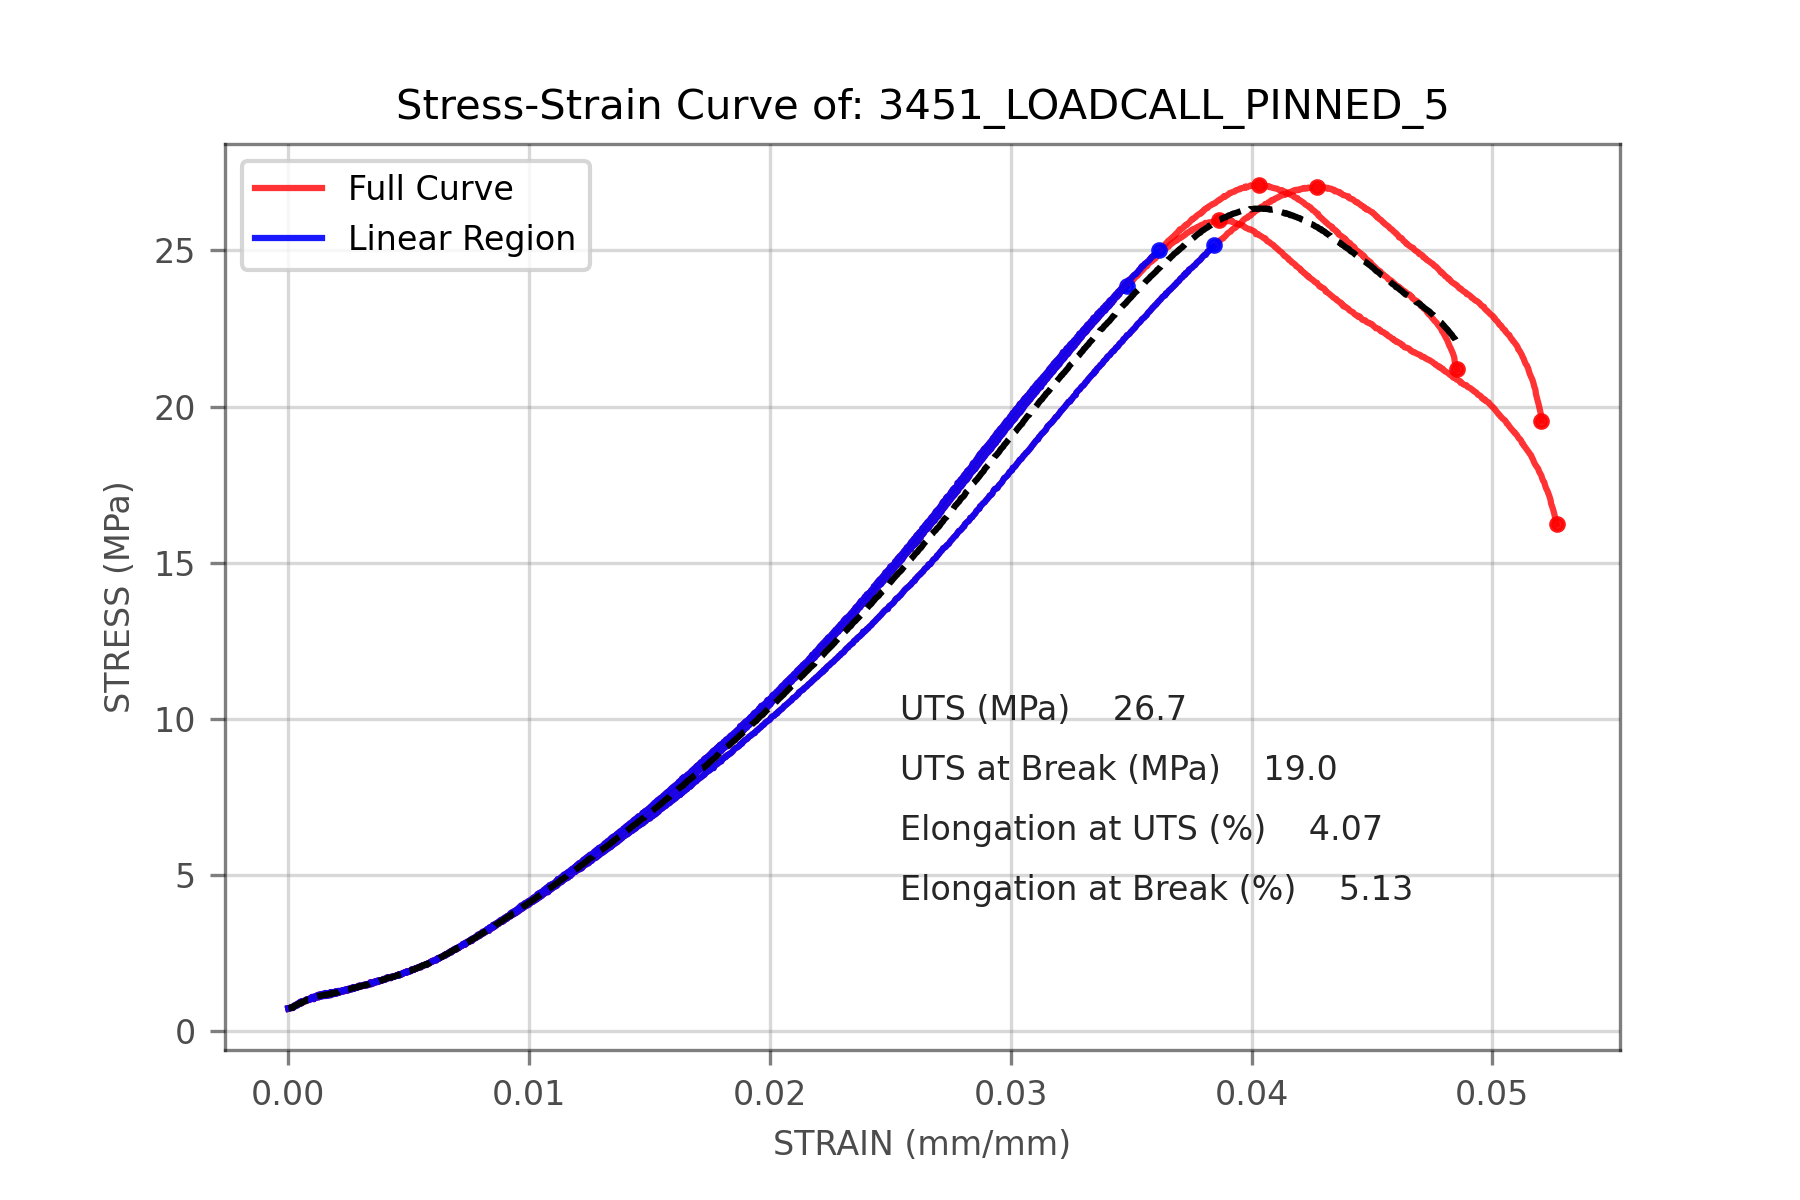 Stretch 1.0 example output stress-strain curve for batch of samples
Additionally we are able to produce boxplots of our batch of samples which is very helpful in determining outliers to not include in our analysis.
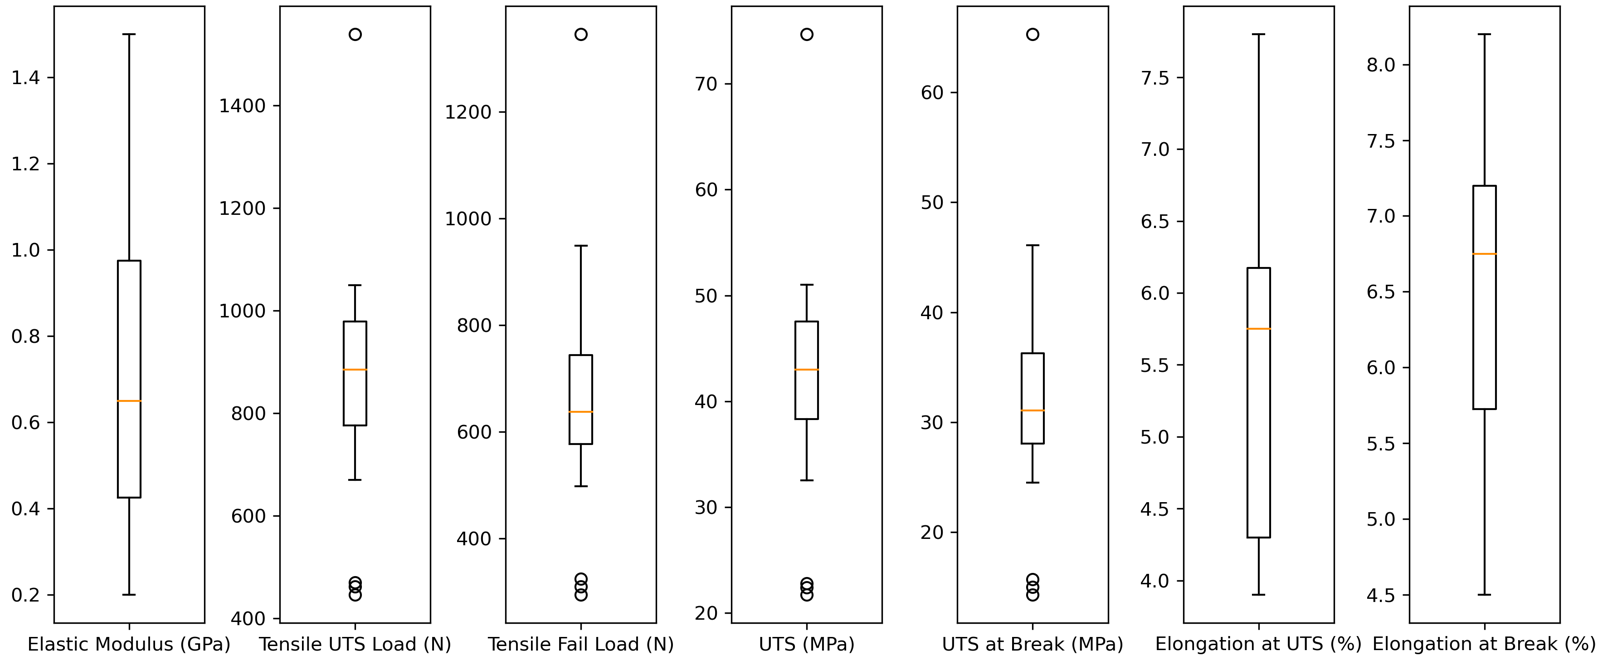 Python code output of Boxplots for each Material Property
Results
As mentioned above, a potential area of value for this product is determining best 3D print properties and materials to utilize in your designs.
1. Different Material Brands
Below we can see the variation in both tensile strength and elongation of different PLA brands using identical print parameters. These variations in properties can’t be found anywhere online but are very useful if you want to choose a material with higher elongation or higher tensile strength. These curves are supposed to be identical as they are the same material but different manufacturers dope their materials with different additives.
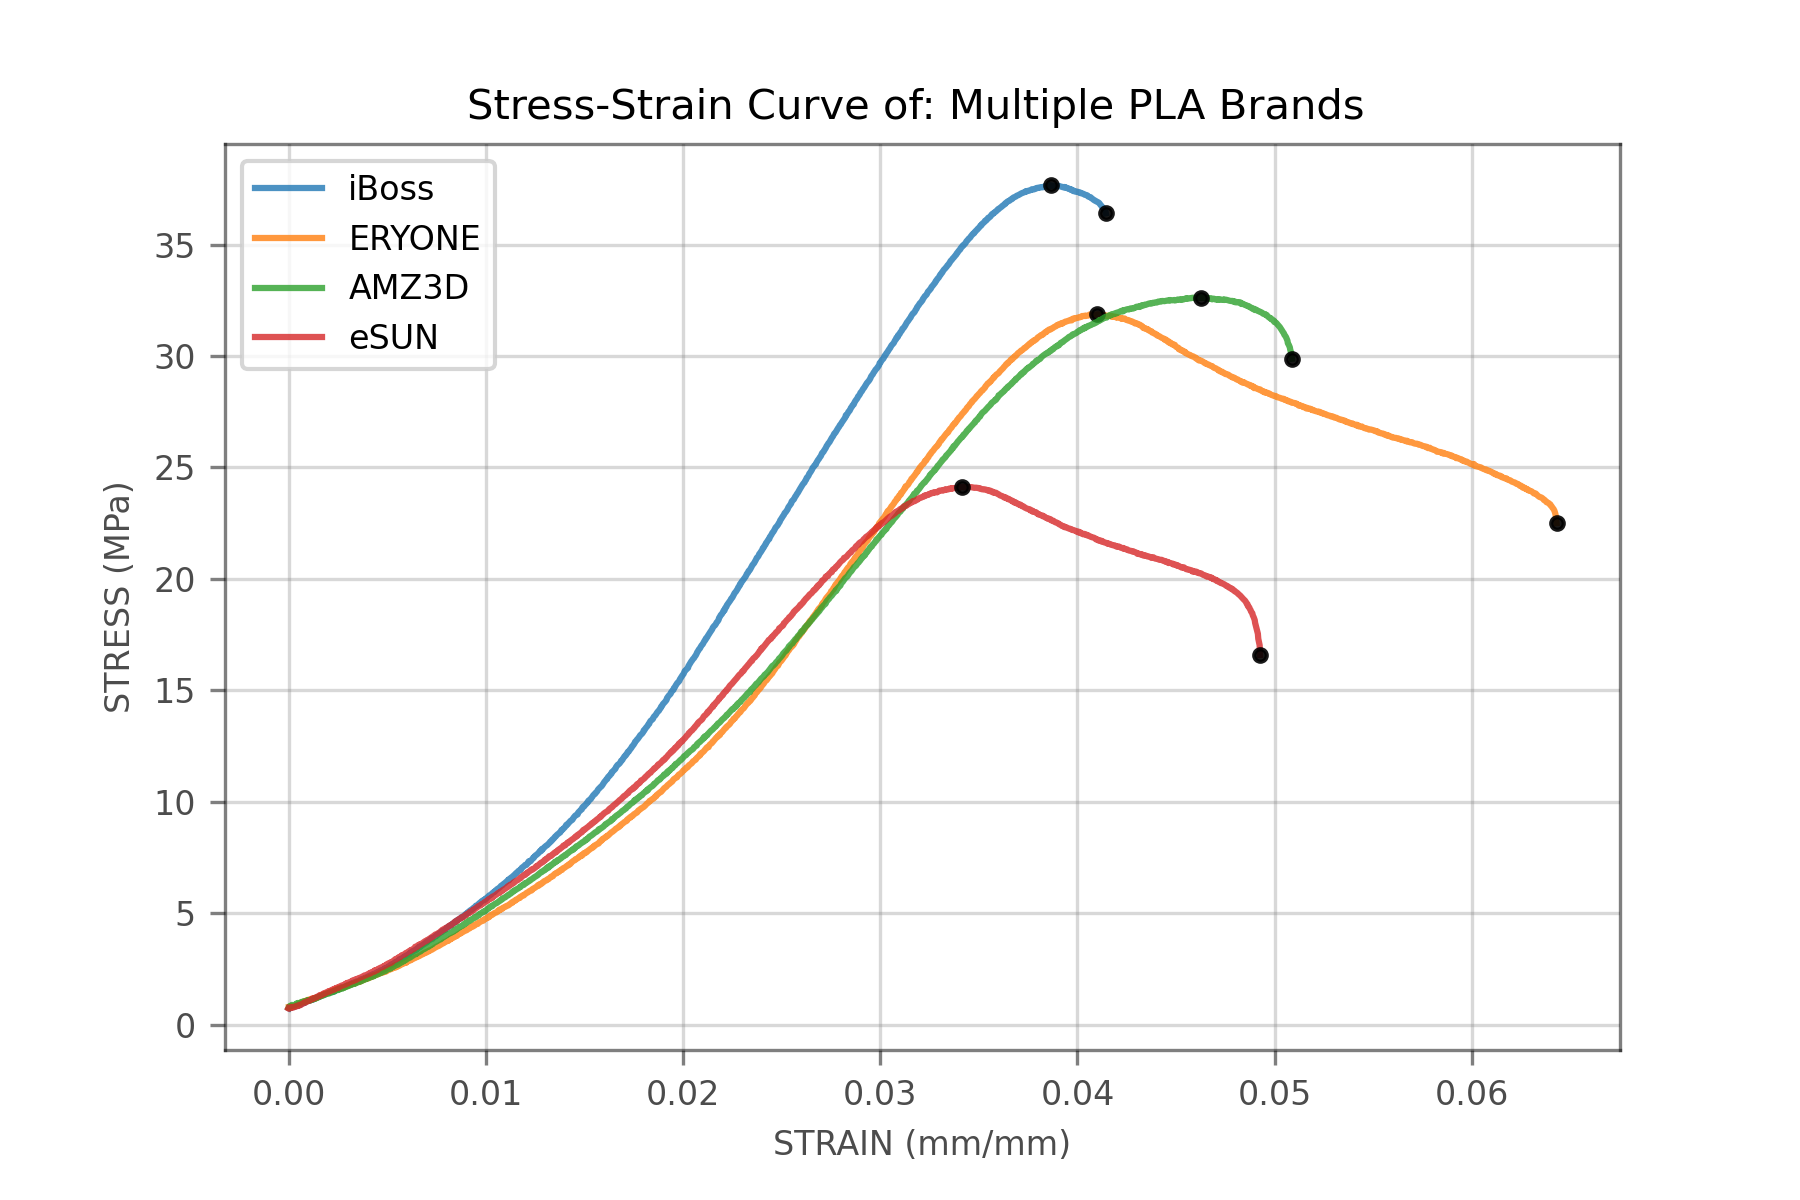 Stress-Strain curve showing multiple PLA brands tested with same print properties
2. Different Print Properties
Additionally, we can start to explore the effect the hundreds of print properties have on the mechanical properties of the material. Below we can see that varying the wall count has a much greater impact on increasing the UTS of the sample than infill density does.
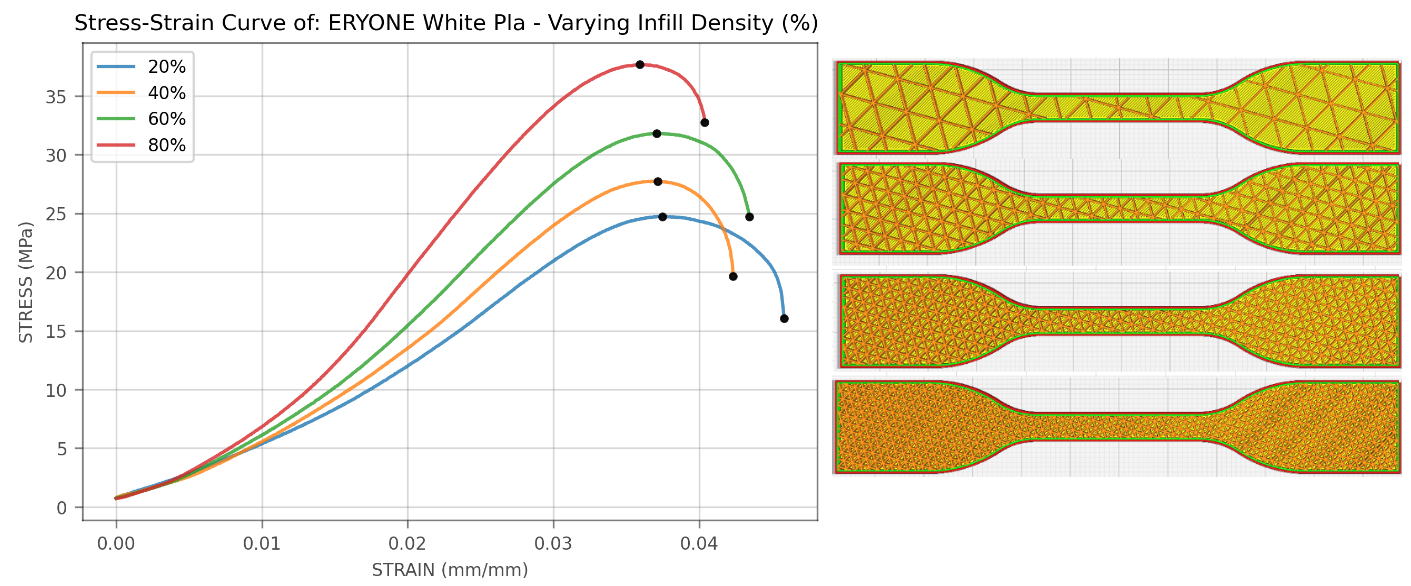 Stress-Strain curve showing the effect of different infill densities on material properties
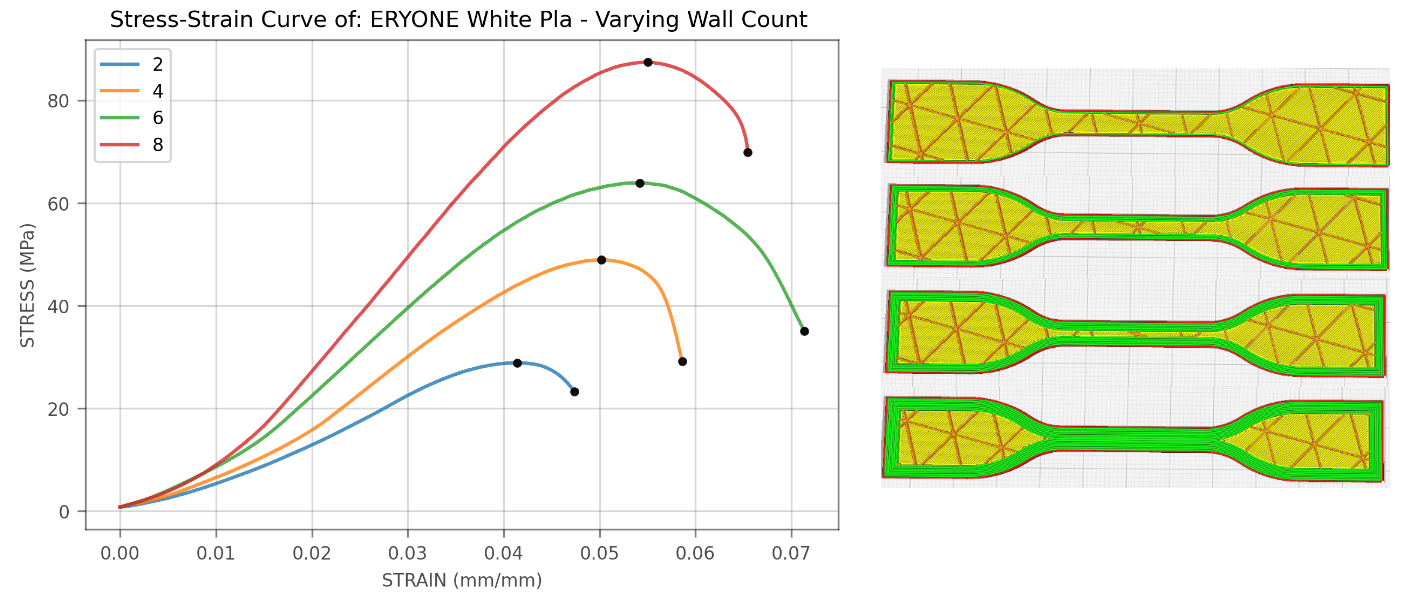 Stress-Strain curve showing the effect of different wall counts on material properties
Additionally, when considering the weight of the sample we can see that the strength/weight ratio is consistently improved with more walls but shows no improvement with higher infill densities.
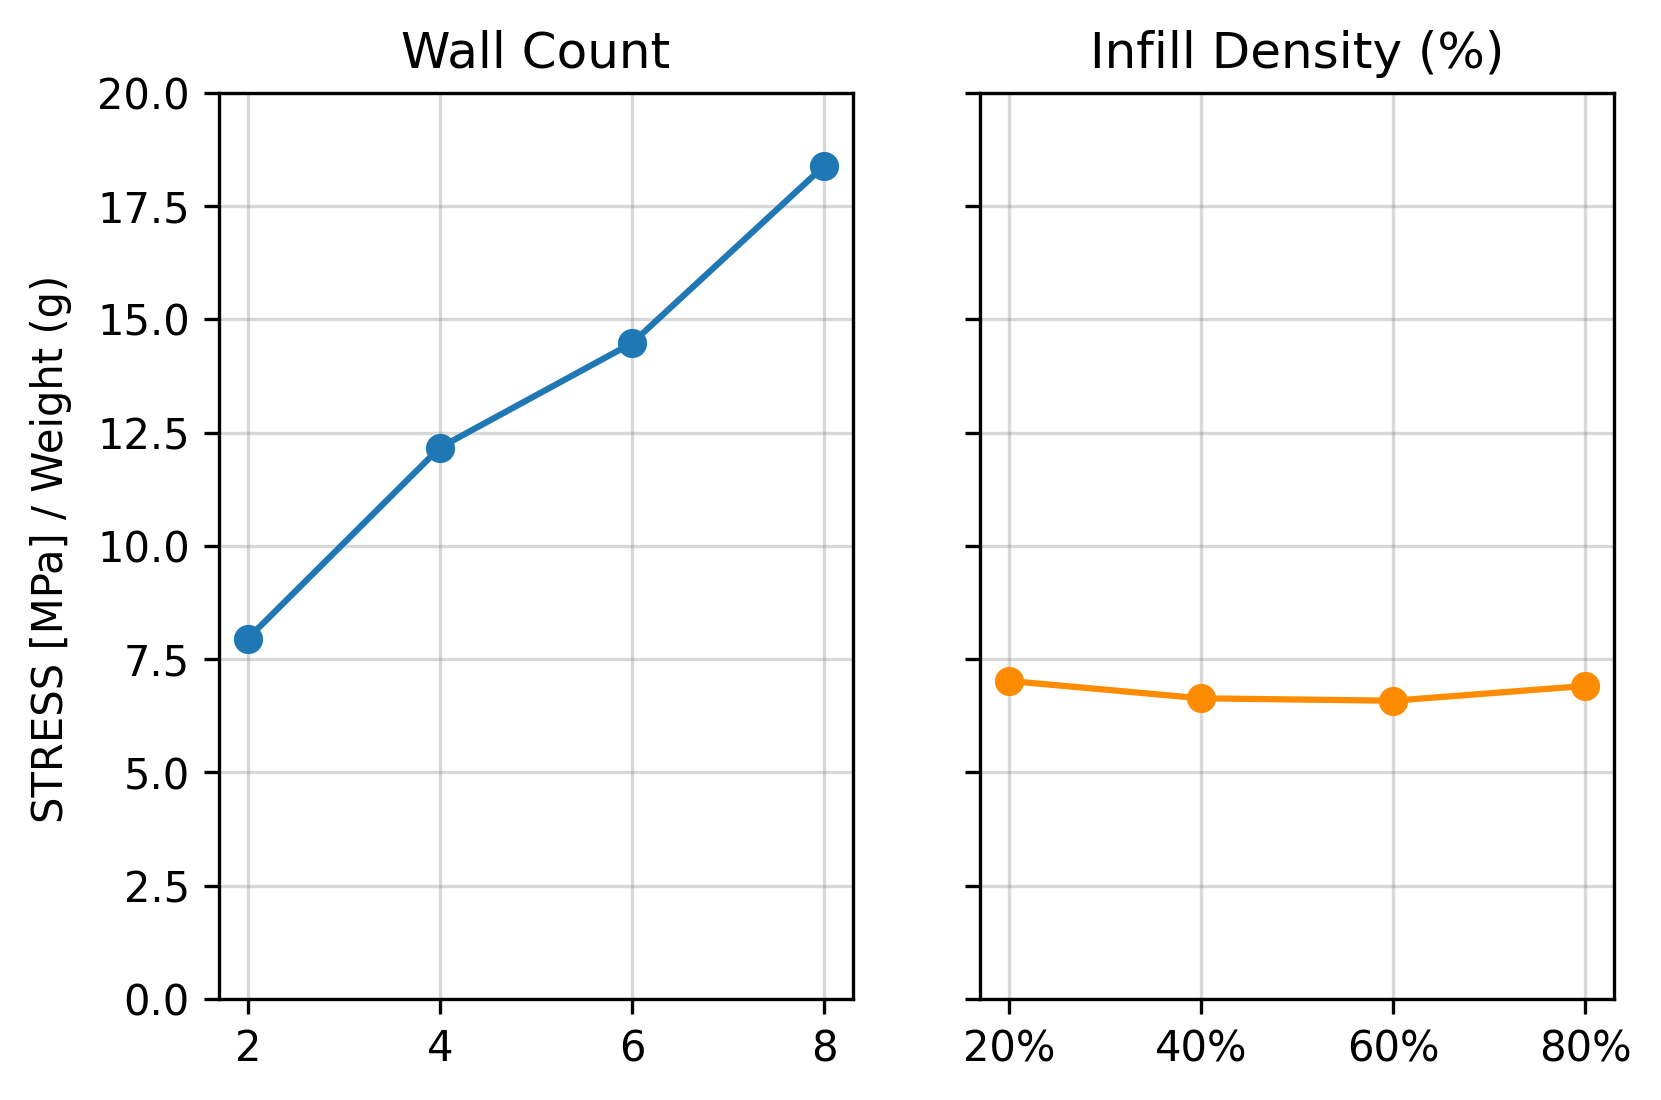 Showing the drastic improvement wall count provides over infill density
These are an illustration of some of the insights this product can provide for the user and I look forward to posting more results in the future!
Compared to Competition - Instron MTS
We tested identical samples from the same print bed on both our device and an Instron MTS with a 5kN load cell to determine the accuracy of our device. We propagated various uncertainties across the data including:
- Human Error - Measurement of Sample CS - Repeatability
- Equipment - Load Cell Uncertainty
- Equipment - Encoder Uncertainty
- Equipment - Digital Caliper
Below we can see the results from testing 10 samples on both Stretch 1.0 and the Instron MTS with the error bars representing the +/- stress. Overall we can see a strong overlap between the samples within the allowable error of the other machine which is promising considering the price difference.
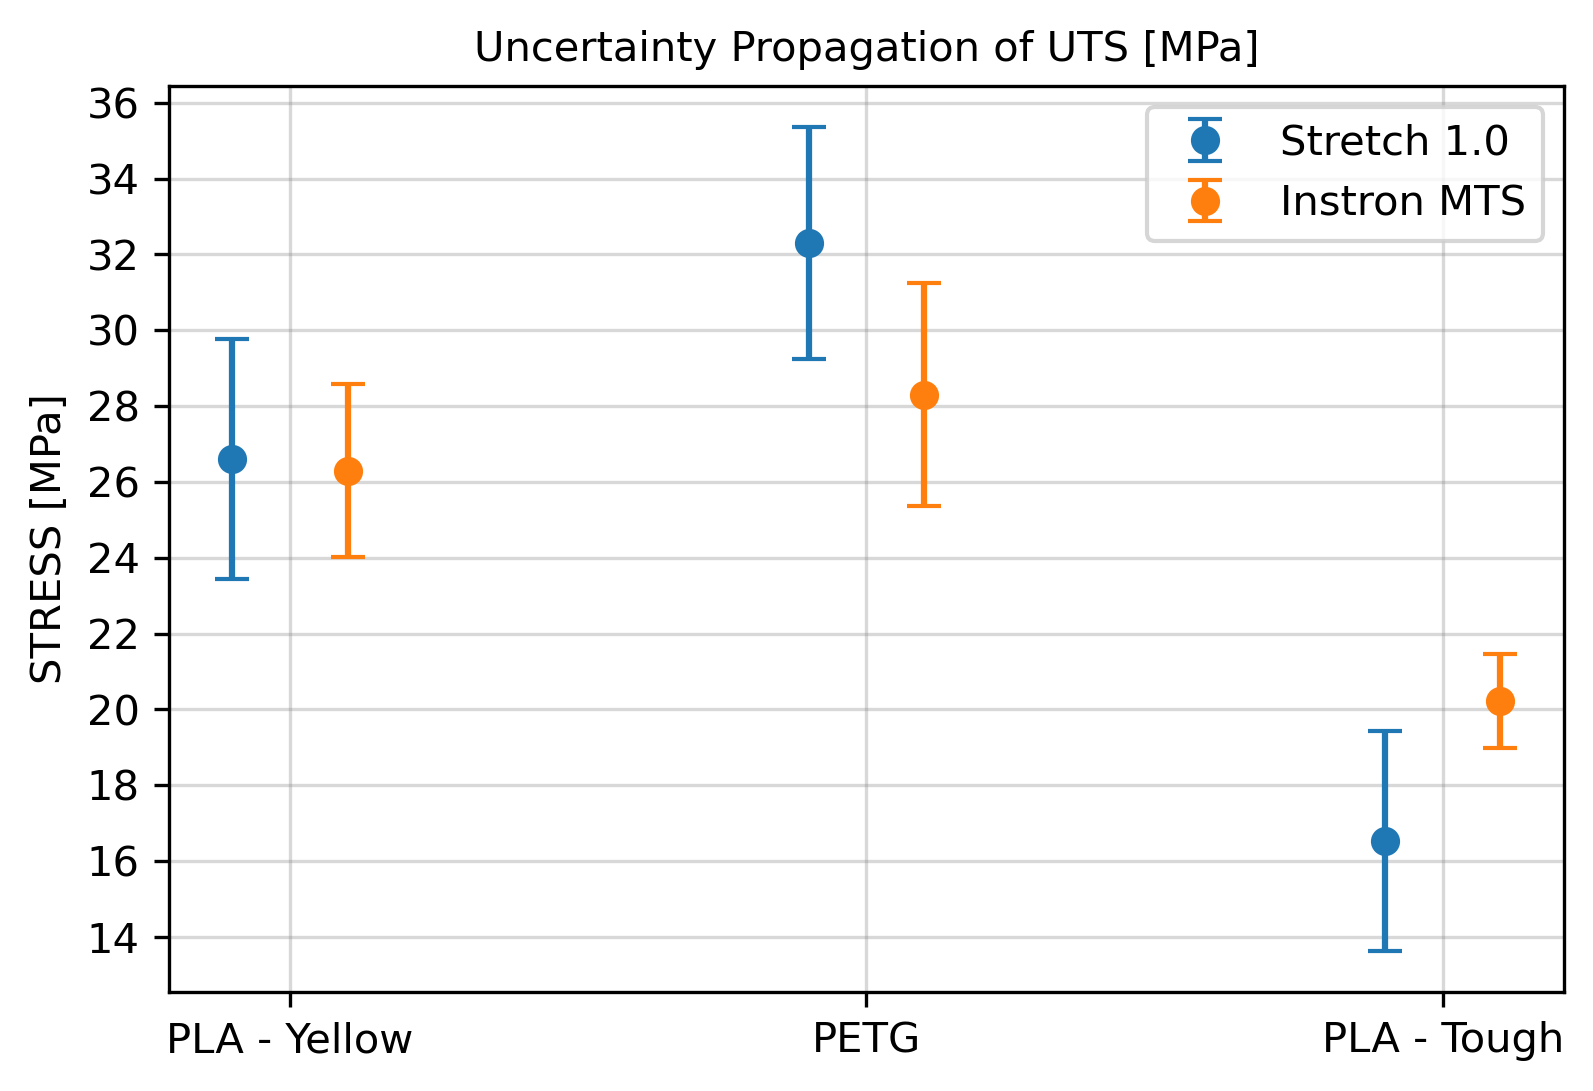 Comparision of UTS values for different materials collected on Instron MTS and Stretch 1.0
References
TestSourcesNet https://www.testresources.net/blog/what-is-the-price-of-a-universal-test-machine/ ↩